

Back to top
nanoCORE Amplicon Metagenomics

Features and Benefits
Fast
- Results delivered within 3 weeks of sample receipt
- Complete service bundle: From sample isolation to advanced library preparation, sequencing, and comprehensive bioinformatic analysis
- Use our drop box in your vicinity for free shipping of samples.
- Get started with your analysis using just one sample!
Cost-Effective
- An economical way to explore your microbial community.
- Select the stages you want to begin and complete for your samples, and we’ll provide highly competitive fixed rates tailored to your specific needs.
- No size restriction of the marker locus
- Sequencing of length polymorphisms
- Increased taxonomic resolution
Workflow
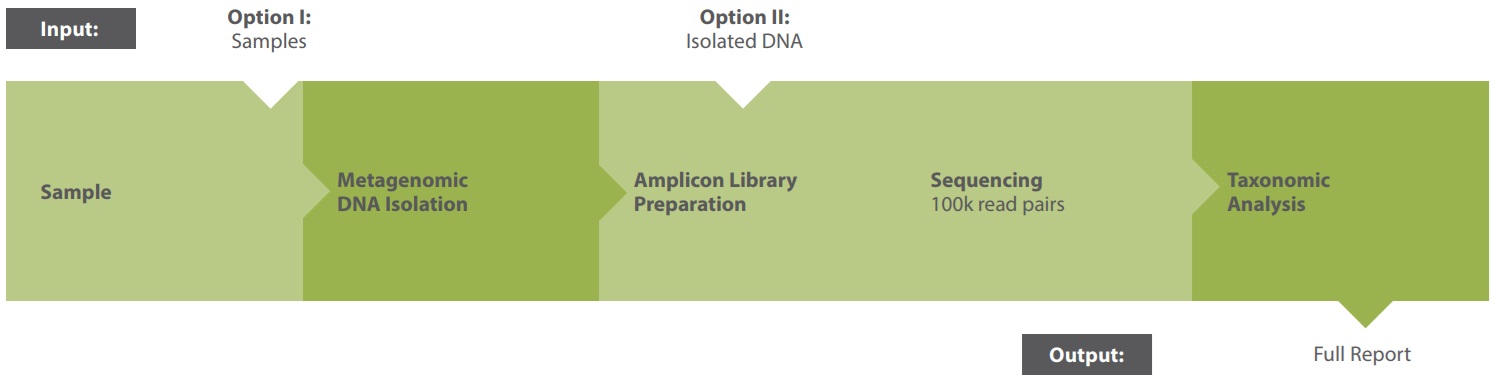
For further reading and a detailed technical description, please download our flyer and user guides (see related downloads).
Results
Standard Bioinformatic Analysis
With Microsynth's standard bioinformatics analysis module for nanoCORE Amplicon Metagenomics, you'll receive comprehensive insights:
- Comprehensive report (in interactive .html format)
This detailed report guides you through the data, allowing sorting and filtering of key results interactively. - Operational Taxonomic Units (OTUs)
OTUs in .fasta format. - OTU Abundance, Taxonomy, and Prediction Confidence (in .tsv format)
Insights into OTU abundance, taxonomy, and prediction confidence. - Intra- and Intersample Diversity Analysis and Rarefaction Curves (in .tsv and .pdf format, see Figure 1 and 2)
Explore intrasample diversity and estimate metagenomic coverage using rarefaction curves. - Metagenome Visualization via Krona Charts (in interactive .html format, see Figure 3)
Easily interpret and explore your metagenomic data through interactive Krona Charts. - Principal Component Analysis (in .tsv and .pdf format)
Visualize and interpret complex relationships through principal component analysis. - Visualization of Statistical Analysis
Access visually informative representations of statistical analyses.
These results provide a comprehensive understanding of your experiment, from an overview down to the nucleotide level, empowering you to make informed decisions and draw meaningful conclusions.
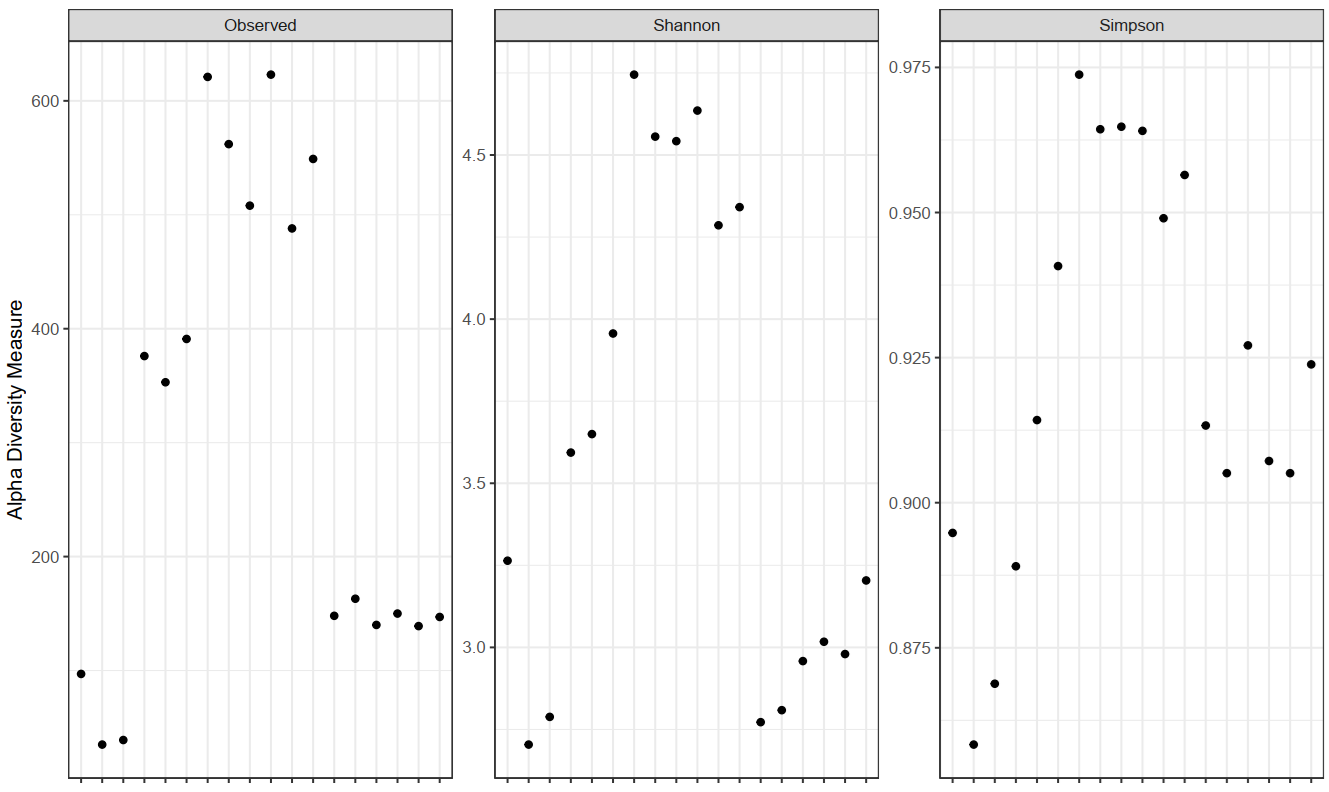
Figure 1: Alpha diversity measures for the analyzed community including observed richness, Simpson indices and the Shannon diversity indices representing the estimated richness and evenness.
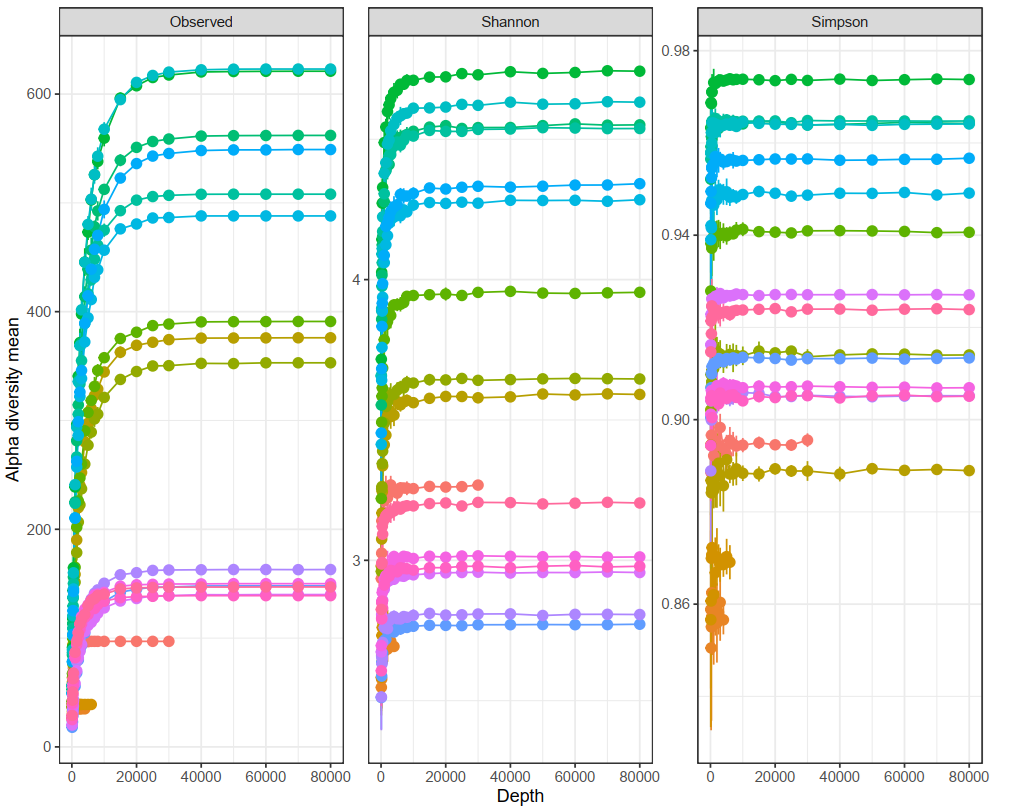
Figure 2: Rarefaction curves depicting alpha diversity across samples from various origins, evaluated through observed species richness, Shannon diversity, and Simpson diversity indices.
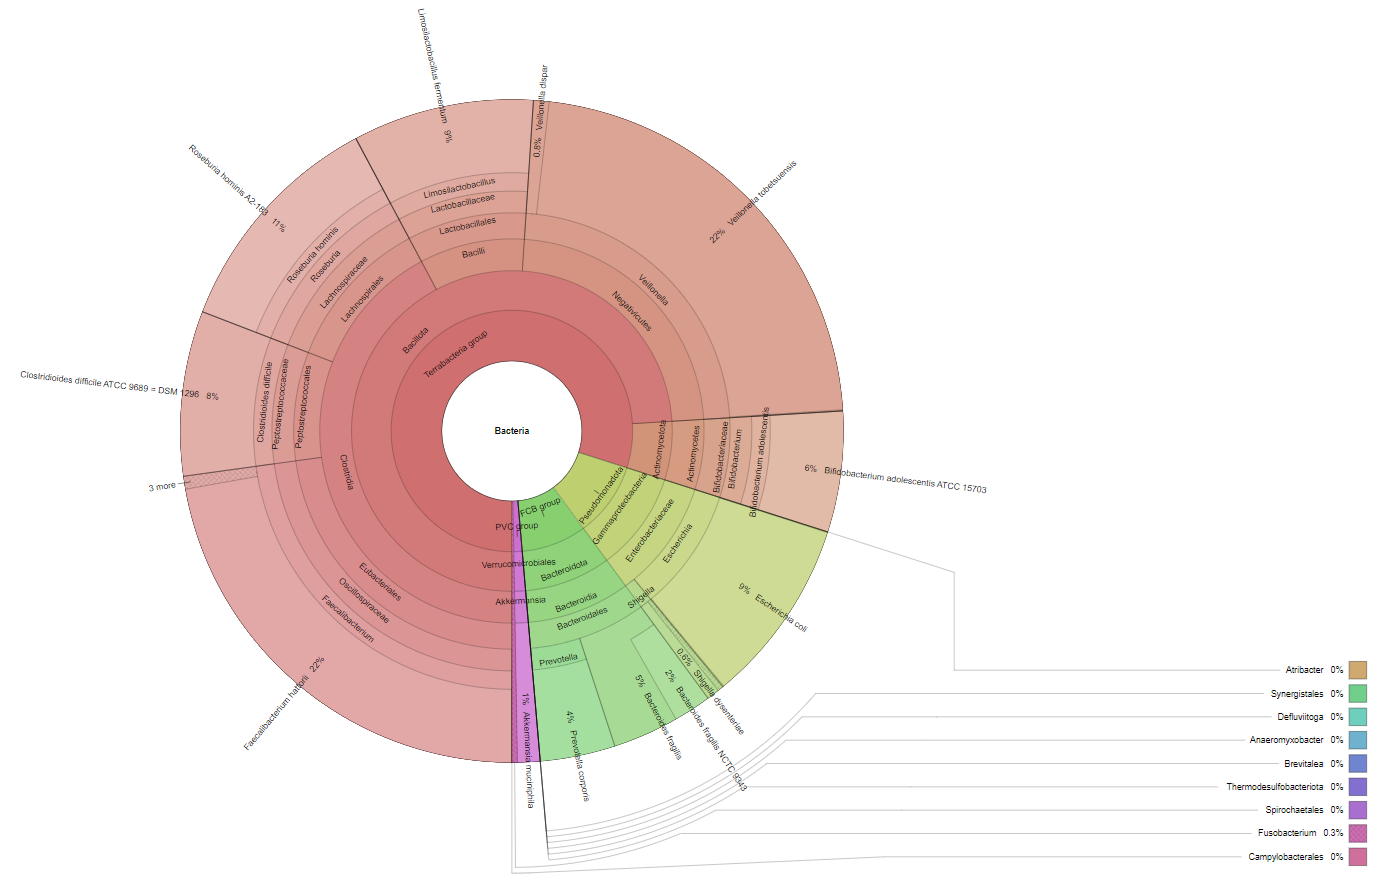
Figure 3: Picture of an interactive Krona chart illustrating a mock community.
Turnaround Time
- Delivery of data within 10 working days upon sample receipt (includes library preparation, sequencing and data analysis/bioinformatics)
- Additional 5 days for DNA isolation