Back to top
Whole Genome Metagenomics Analysis of Microbiota

- Study the genetic potential of your bacterial community samples
- Generate hypothesis-free taxonomic analysis
Overview
Considerations before starting a shotgun metagenomics project:
- Sample amounts and origin?
- Sequencing depth (sensitivity)?
- Focus on genetic potential or on taxonomy?
- Community complexity and constitution?
- Descriptive and/or empirical study?
Let us guide you – from design to analysis
Example projects using shotgun metagenomics:
- Community analysis of microbial communities
- Shift of communities and genomic potential upon changed environmental conditions
- Evolutionary adaptations in micro-environments
- Gene-level analysis of uncultivatible microbial communities
- Virus detection within mammalian tissues and exudates
Applications related to shotgun metagenomics:
- Amplicon metagenomics
- Shotgun metatranscriptomics
- Bacterial resequencing
Workflow
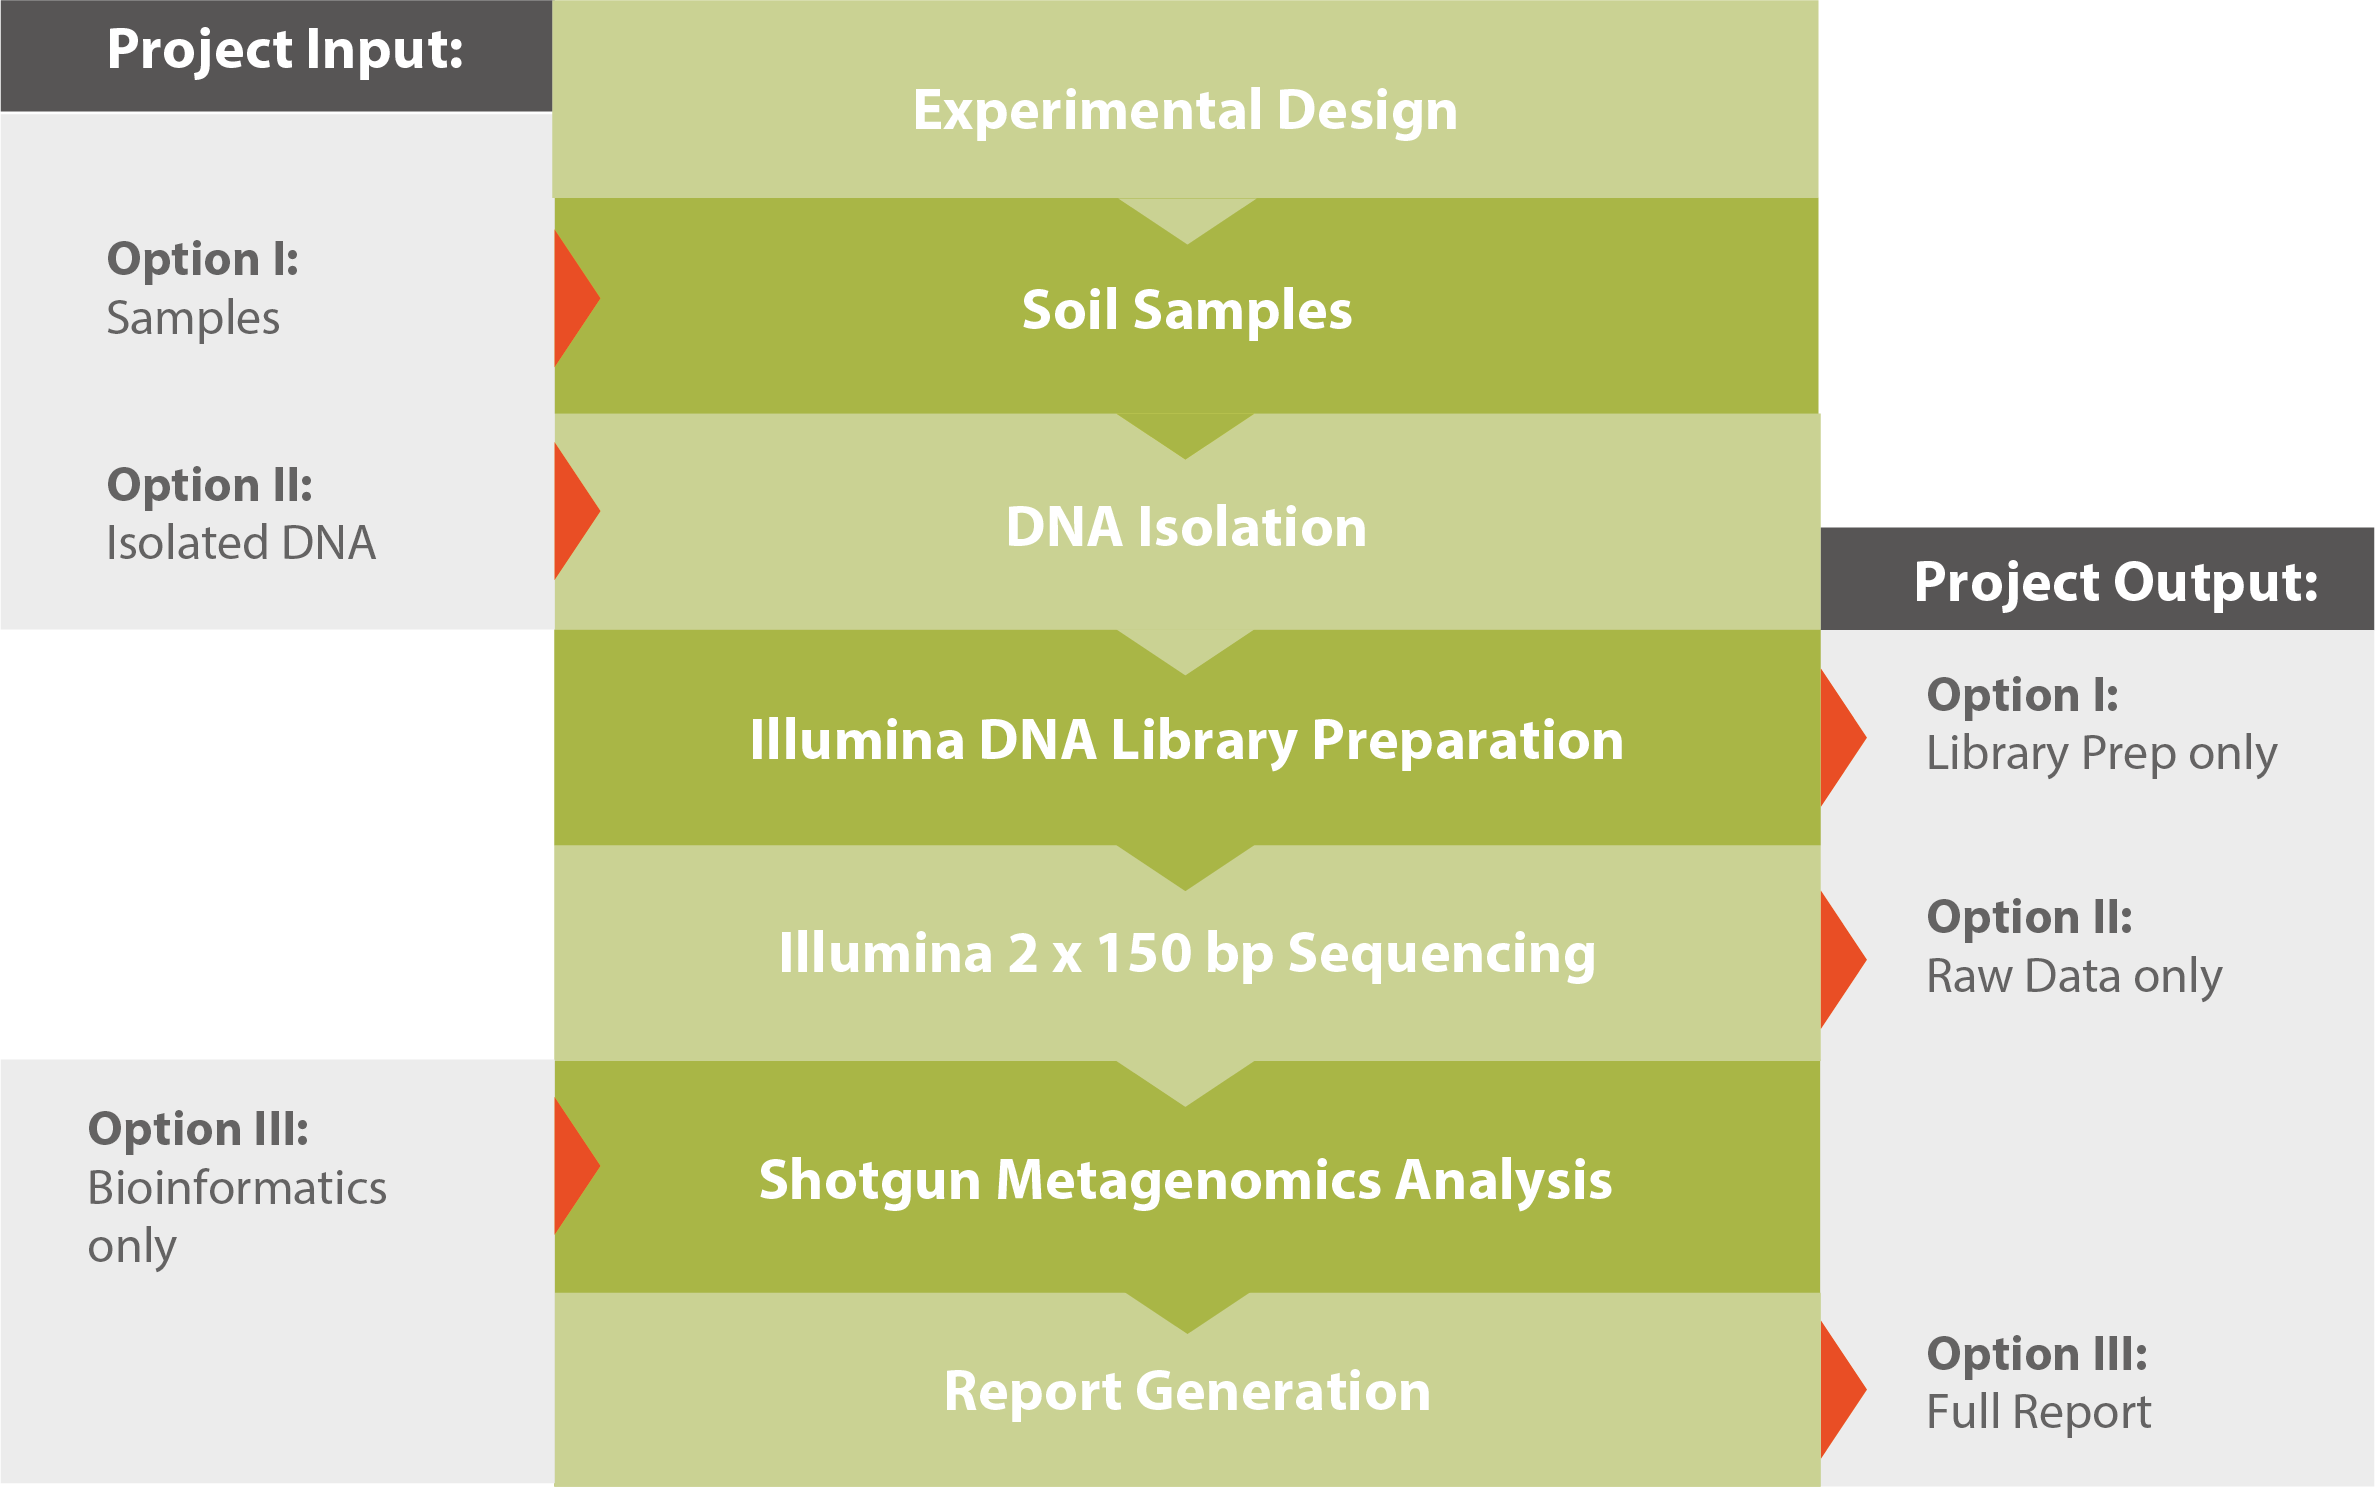
For further reading and a detailed technical description, please download our Application Note Shotgun Metagenomics (see related downloads).
Results
In contrast to amplicon based metagenomic studies shotgun metagenomics is not based on a single phylogenetic marker gene but takes into account all DNA retrieved from a sample. Therefore eukaryotic and prokaryotic organisms in a microbial community can be analyzed simultaneously. Shotgun metagenomics is not limited to the taxonomic composition of a community but also reveals its inventory of functional genes.
Analysis of shotgun metagenomics datasets is challenging due to their size. Especially the alignment of the reads against a reference database is the major bottleneck and requires adequate hardware and software resources. Our shotgun metagenomics analysis module runs on high performance servers using the fastest available tools. The module will help you to answer the following questions:
- What is the taxonomic composition (both eukaryotic and prokaryotic) of the microbial community? (see Figure 1)
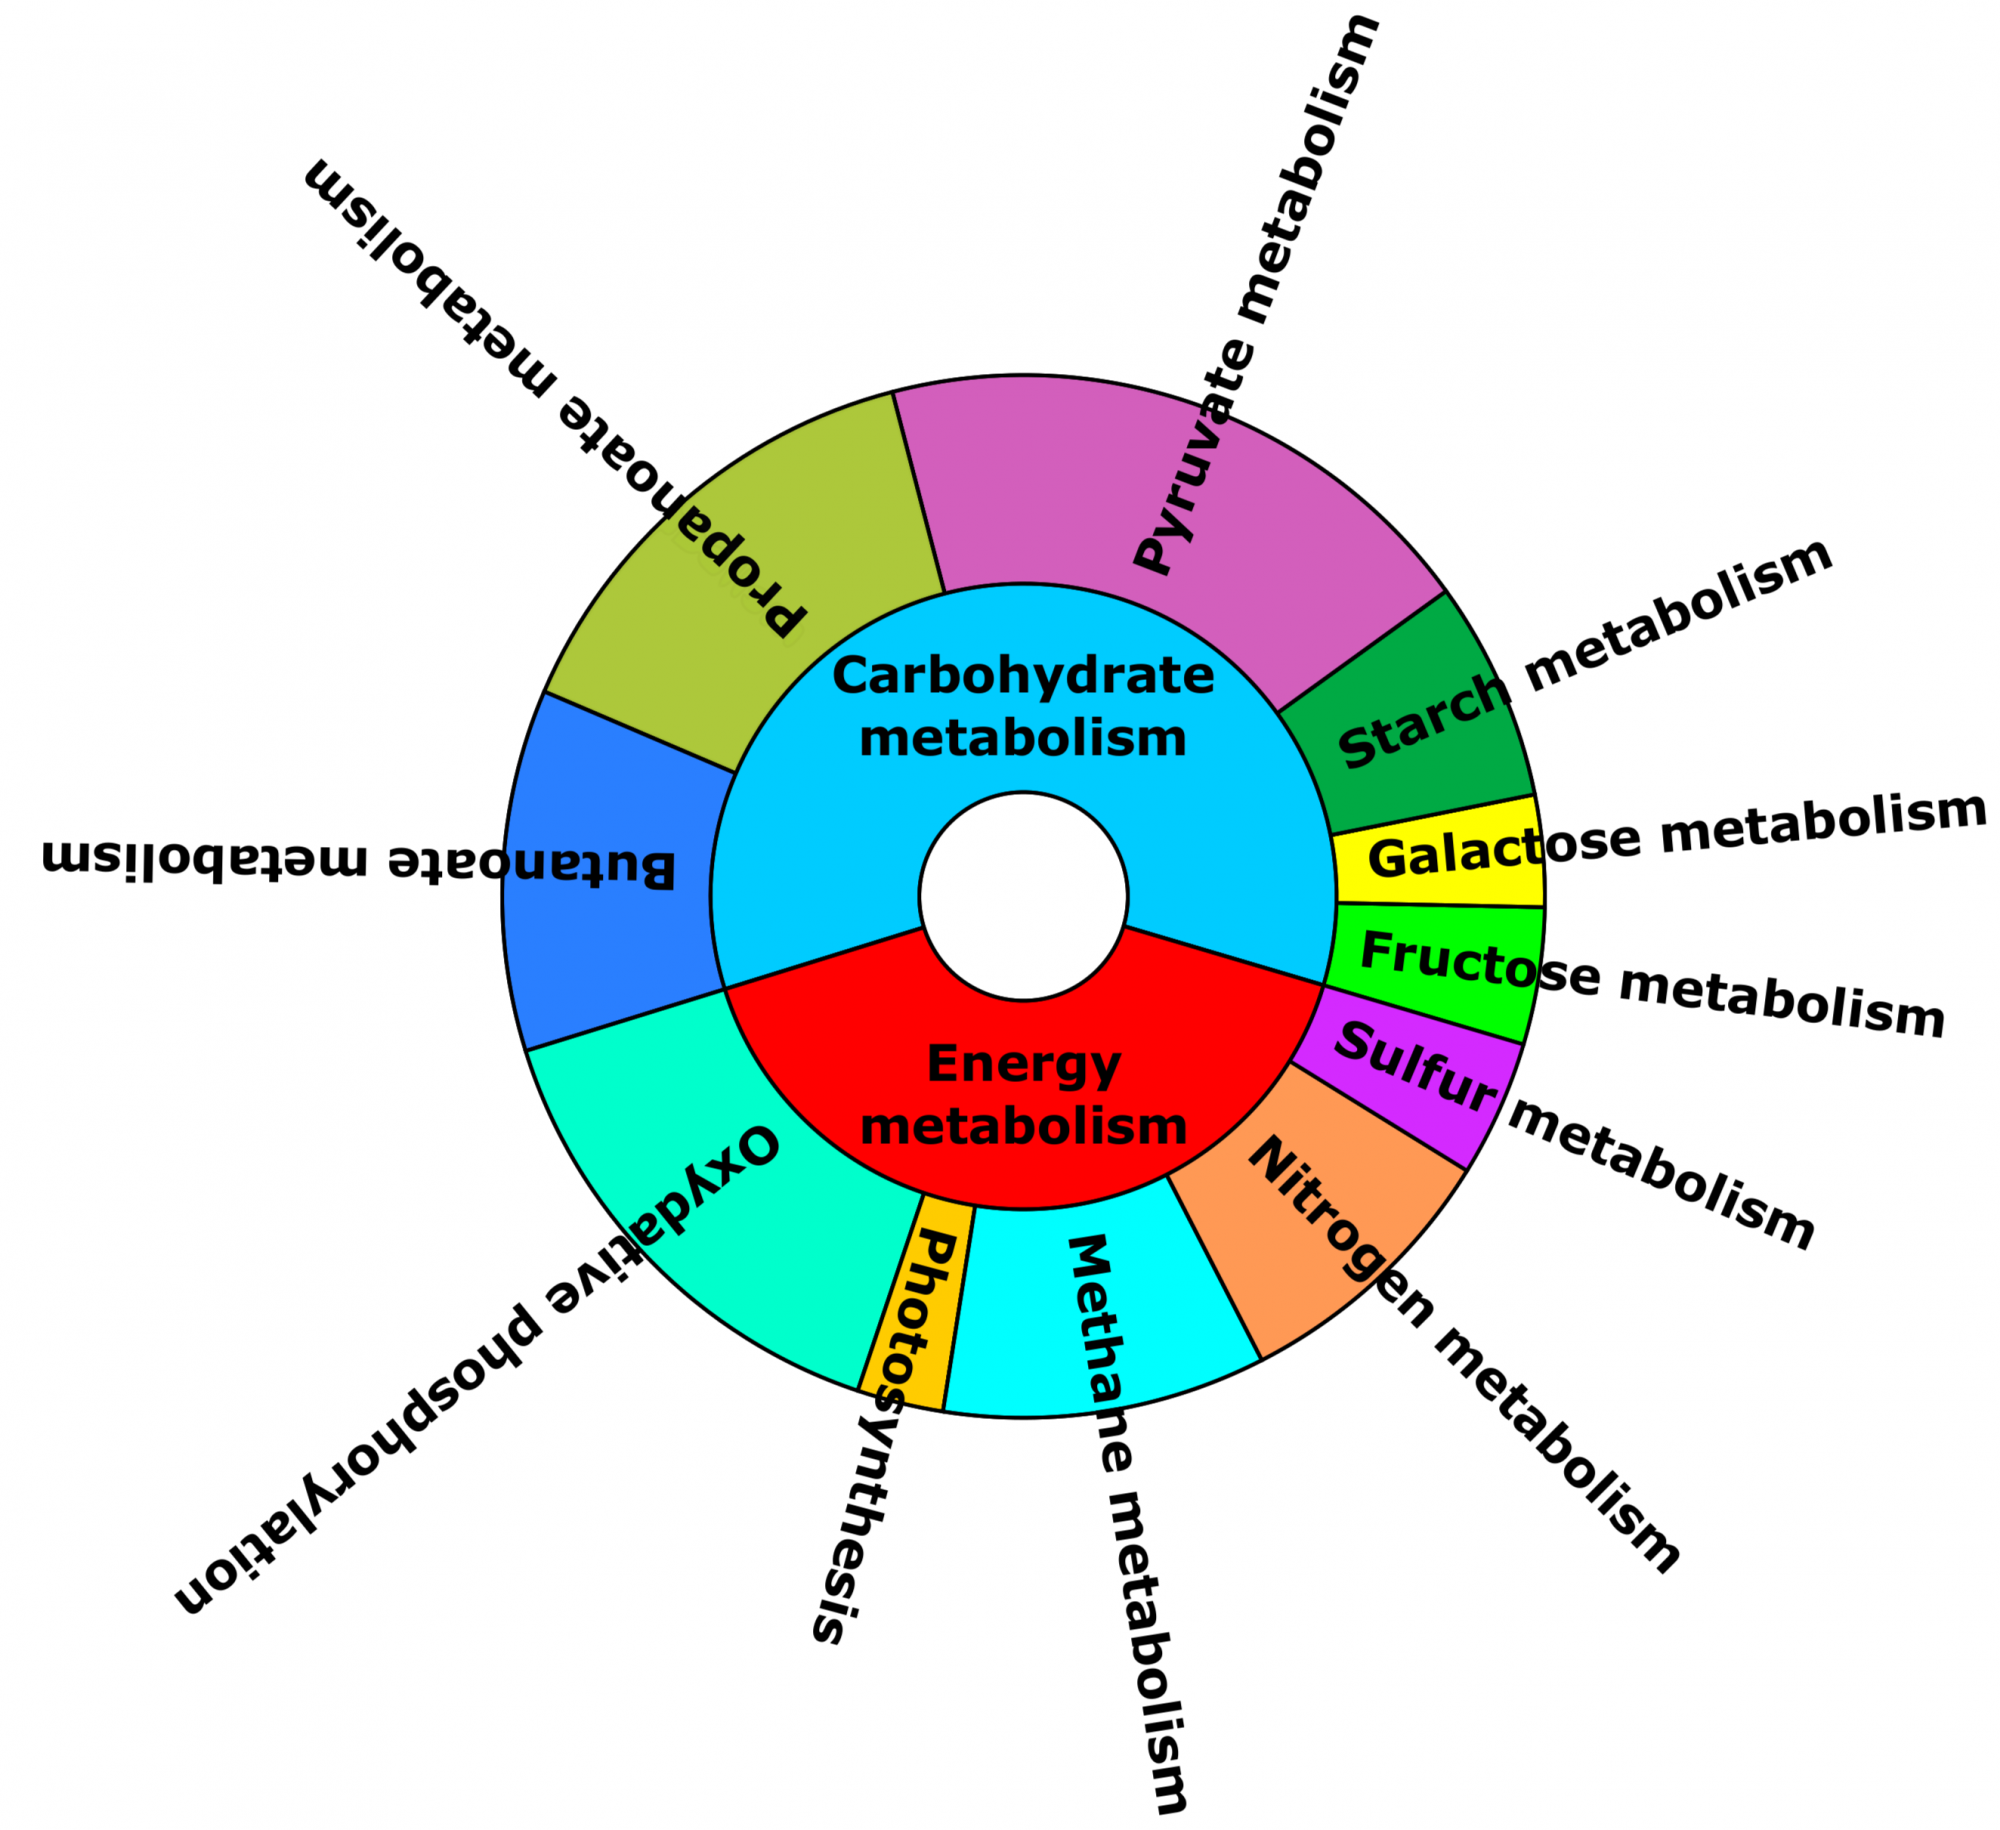
- What is the functional potential of the microbial community? (see Figure 2)
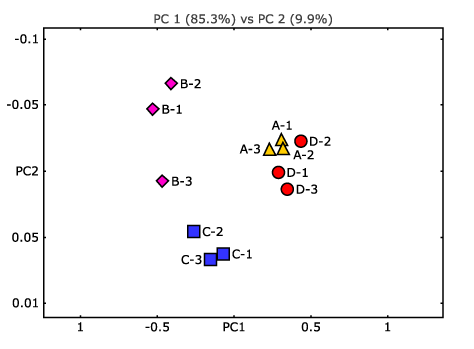
- Are there any taxonomic and functional features that are differentially abundant between communities or conditions? (see Figure 3)
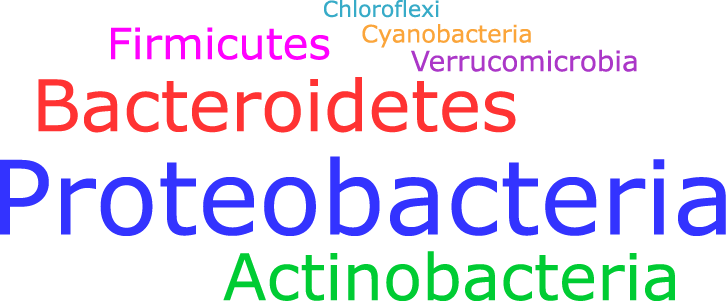
Figure 1: Word cloud representing the bacterial composition of a community on the phylum level. Size of the words are proportional to the phylum abundance.
Turnaround Time
- Delivery of data within 25 working days upon sample receipt (includes library preparation and sequencing)
- Additional 10 working days for data analysis (bioinformatics)
- Express service possible on request


